Search results
Debugging apps
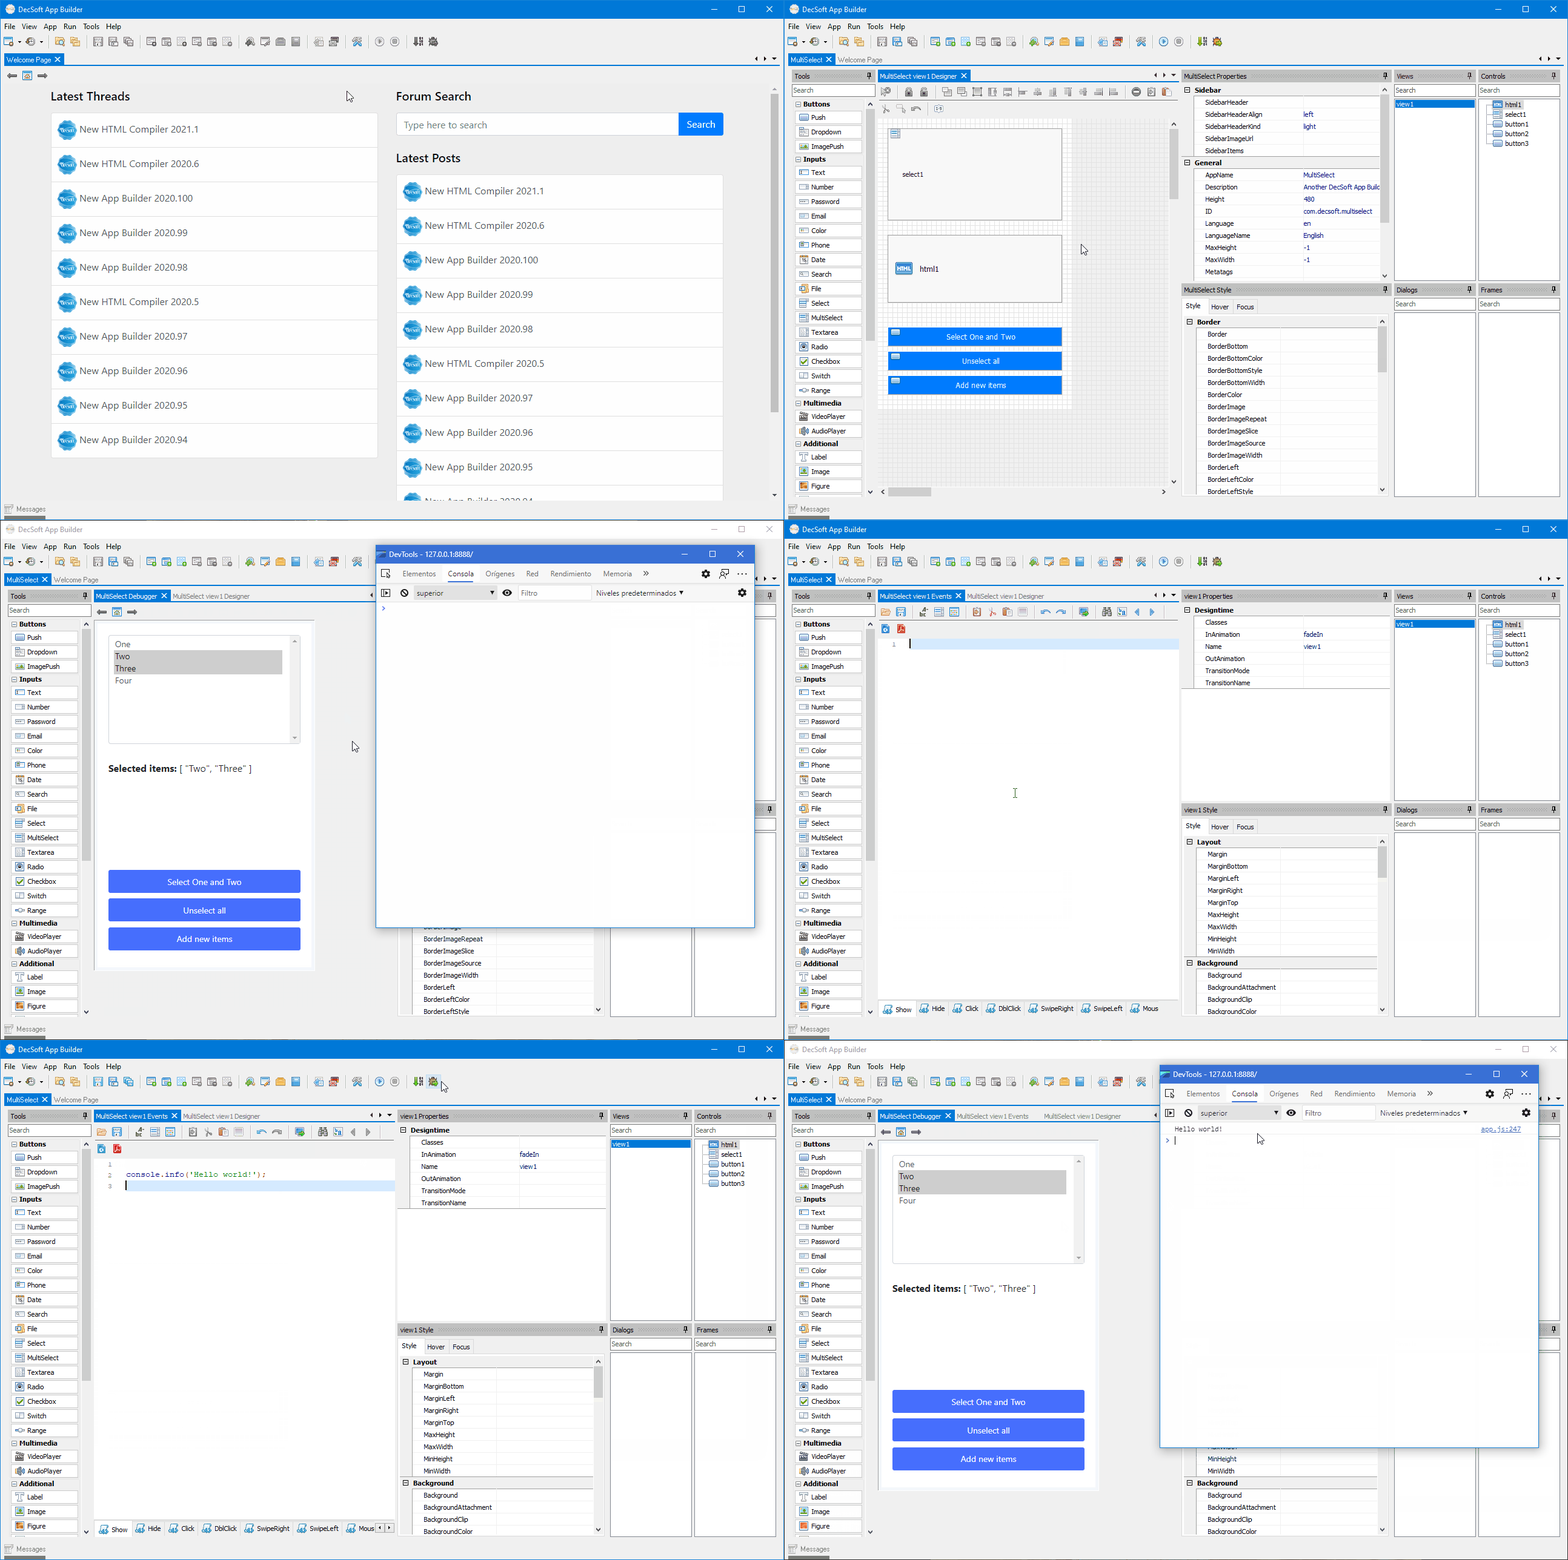
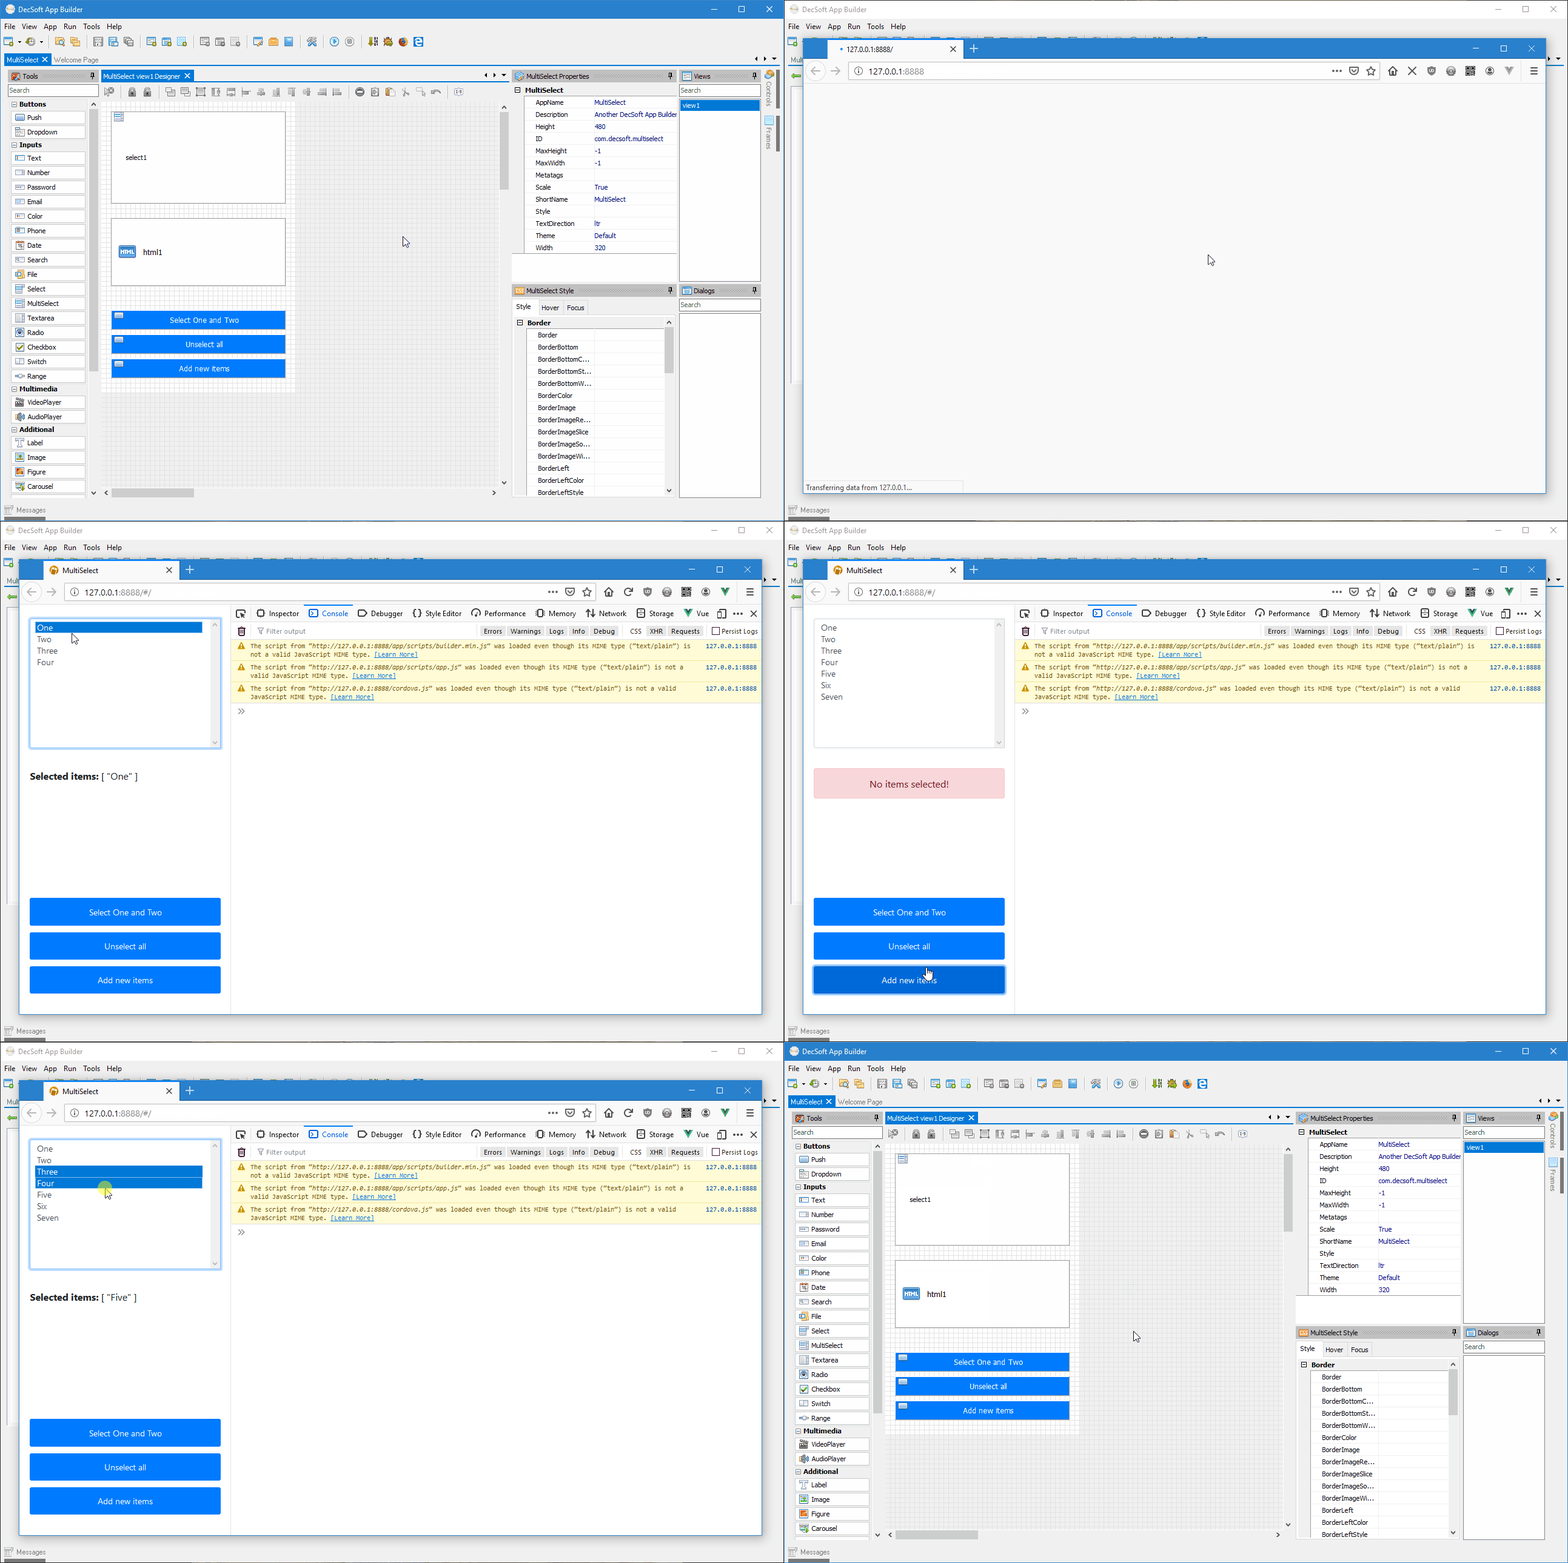
DecSoft App Builder incorporates an internal debugger browser based in Chromium (an open source derived from Google Chrome) ready to be use to debug your apps. The debugger show your app running and also a complete developer console which you can use to debug your apps, integrating such browsers' icons in the DecSoft App Builder IDE toolbar, as you can see below.
Compile, Debug and Run
In the DecSoft App Builder IDE main toolbar, you can see the below four buttons, that must be well explained, from left to right:

Run button
The Run button is intended to launch the app in the internal debugger browser without save nor compile it first. In other words, the Run button launch the latest compilation of the app, if any. Just this can be useful, because allows to launch the app as fast as possible, since is not saved nor compiled before launch.
However, the Run button is particularly useful because DecSoft App Builder allows to open the compiled "app.js" in the code editor (Main Menu -> App -> Open app.js). So the point is that you can perform changes in the "app.js" file, save it, and then launch the app using the Run button.
Since the app is not compiled, what you can see running when the app is launched, is your modify "app.js" file. And that's exactly wnat you wanted: made some changes in the "app.js" and then launch the app is a very good way to debug some specific things.
Stop button
Not too much to say, the Stop button just stop the internal HTTP Server and close the debugger internal browser window.
Compile button
The Compile button compile the app without save it firstly. Sometimes you don't want to debug the very latest changes, but the "current state" of the app, to say like that, so you can press the Compile button, without firstly save the app.
The Compile button is what you must use when want to deploy the app, that is, to made the "to be deployed" compilation of your app, you must save it first, and then, press the Compile button. What you get is an app compilation ready to be deployed, without including any debug code related.
Debug button
The Debug button save the app, if it's modified, then compile the app, including some debug related stuff, and finally launch the app in the internal debugger browser. Note that compile the app means also that the "app.js" is rewrited: if you modify it first to debug something... you must use the Run button (see above) instead the Debug button.
External browser buttons
Probably you set some external browser to be used to debug the app (see below). The buttons for these external browsers appear at the right of the Debug button, and, when you press one of them, what that button do is the same than the Debug button, except that additionally launch the app in the specified browser.
Debugging using the internal browser
Many times the internal browser is enough to debug the app, so, we can simply use it as you can see in the below animated GIF image:

